Ernex

ernex

Discuss an engagement

Discuss an engagement

RESEARCH / PUBLIC PROCUREMENT SERIES / IT AND DIGITAL 2026

RESEARCH / PUBLIC PROCUREMENT SERIES / IT AND DIGITAL 2026

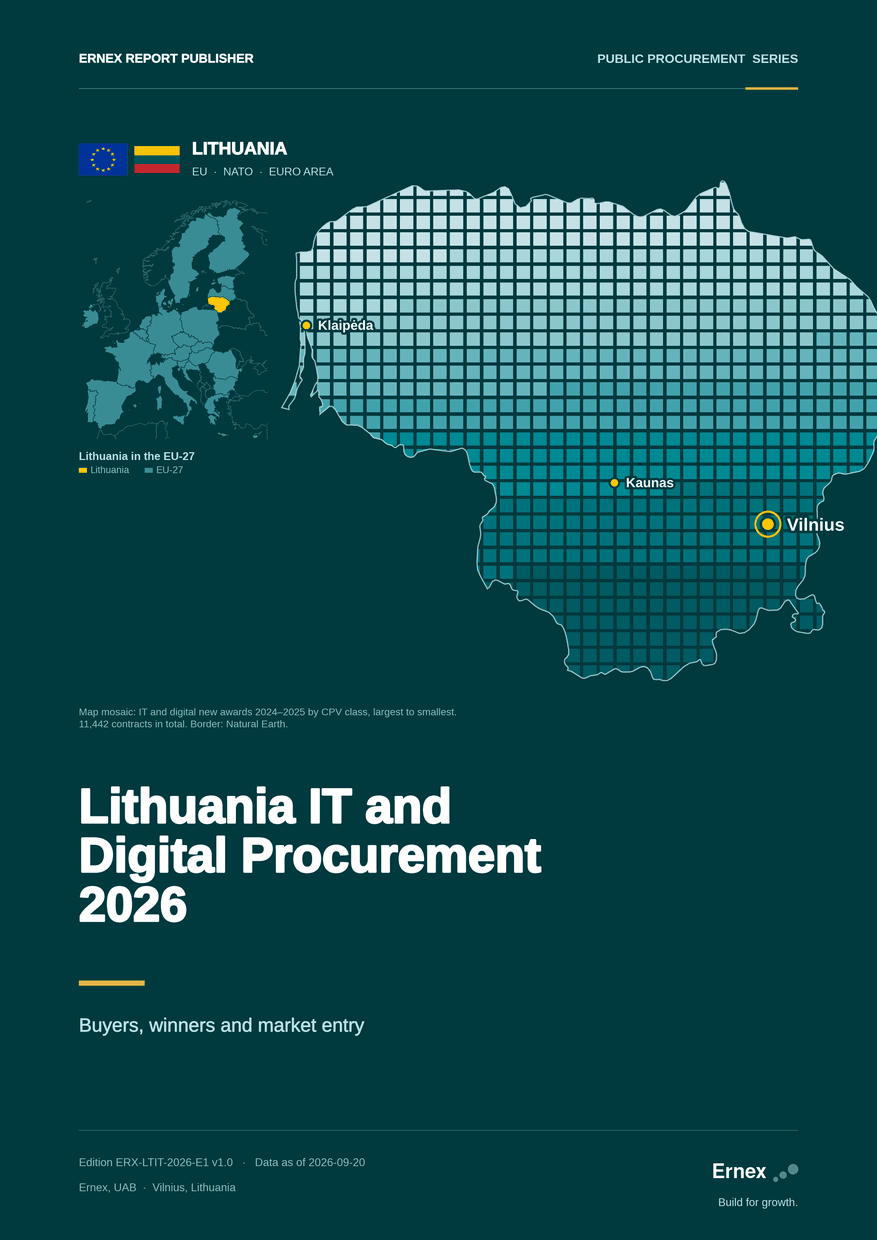
Lithuania IT and Digital Procurement 2026

Lithuania IT and Digital Procurement 2026

Lithuania IT and Digital Procurement 2026

Buyers, winners and market entry, for software, services and hardware firms outside Lithuania assessing entry, for Lithuanian suppliers already bidding, and for the researchers and consultants who describe the sector.
EDITION ERX-LTIT-2026-E1 v1.0

PAGES 56 English PDF

DATA as of 20 September 2026

PERIOD 1 January 2024 to 20 September 2026

Headline measures cover the two full years 2024 and 2025. 2026 year to date is reported separately and is not comparable.

EDITION ERX-LTIT-2026-E1 v1.0

PAGES 56 English PDF

DATA as of 20 September 2026

PERIOD 1 January 2024 to 20 September 2026

Headline measures cover the two full years 2024 and 2025. 2026 year to date is reported separately and is not comparable.

Lithuania Construction and Infrastructure Procurement 2026, report cover

11.33%

11.33%

Of every new public contract awarded in Lithuania is IT or digital. By value the same four CPV divisions are 1.45 bn EUR, 6.62% of the market.

Of every new public contract awarded in Lithuania is IT or digital. By value the same four CPV divisions are 1.45 bn EUR, 6.62% of the market.

84.67%

84.67%

Of new IT services and software award value comes back later as amendments to the same contracts. For computing and telecom hardware the same measure is 22.62%, and the difference is where recurring revenue sits.

Of new IT services and software award value comes back later as amendments to the same contracts. For computing and telecom hardware the same measure is 22.62%, and the difference is where recurring revenue sits.

7,076

7,076

IT and digital contracts published in 2026 to 20 September, awarded by 1,324 contracting authorities. The source does not publish the change order flag for 2026, so that count is not split between new contracts and re-pricing of existing ones.

IT and digital contracts published in 2026 to 20 September, awarded by 1,324 contracting authorities. The source does not publish the change order flag for 2026, so that count is not split between new contracts and re-pricing of existing ones.

29,916

29,916

Rows and 23 columns in the data pack, one row per contract, services and hardware held apart and never summed. The award record, the annual contract files and the code lists are not published together. This edition reads them into one table where a column means the same thing in every row.

Rows and 23 columns in the data pack, one row per contract, services and hardware held apart and never summed. The award record, the annual contract files and the code lists are not published together. This edition reads them into one table where a column means the same thing in every row.

“IT and digital is one in nine of every new public contract this register publishes, and in services and software nearly half the recorded value arrives after the award rather than at it.”

“IT and digital is one in nine of every new public contract this register publishes, and in services and software nearly half the recorded value arrives after the award rather than at it.”

“IT and digital is one in nine of every new public contract this register publishes, and in services and software nearly half the recorded value arrives after the award rather than at it.”

What it answers

What it answers

What it answers

Every question below is answered in a named section, not implied.

Every question below is answered in a named section, not implied.

01

01

How large is the Lithuanian public IT market a supplier can actually bid for, as opposed to the figure the register publishes?

How large is the Lithuanian public IT market a supplier can actually bid for, as opposed to the figure the register publishes?

How large is the Lithuanian public IT market a supplier can actually bid for, as opposed to the figure the register publishes?

SECTION 5.2 THE HEADLINE FIGURES

SECTION 5.2 THE HEADLINE FIGURES

02

02

Where in that market does the money sit, and which of the five segments holds it?

Where in that market does the money sit, and which of the five segments holds it?

Where in that market does the money sit, and which of the five segments holds it?

SECTION 6.7 THE FIVE SEGMENTS SIDE BY SIDE

SECTION 6.7 THE FIVE SEGMENTS SIDE BY SIDE

03

03

Is this market as open as its published concentration figure suggests, and what does it look like at the level where an offer is made?

Is this market as open as its published concentration figure suggests, and what does it look like at the level where an offer is made?

Is this market as open as its published concentration figure suggests, and what does it look like at the level where an offer is made?

SECTIONS 5.3 AND 5.4 CONCENTRATION AS A BAND

SECTIONS 5.3 AND 5.4 CONCENTRATION AS A BAND

04

04

Services and hardware are sold as one sector. Do they behave as one market?

Services and hardware are sold as one sector. Do they behave as one market?

Services and hardware are sold as one sector. Do they behave as one market?

SECTIONS 6.6 AND 8.3 TWO BUSINESSES

SECTIONS 6.6 AND 8.3 TWO BUSINESSES

05

05

Which statute does a given buyer procure under, and why does that decide everything else?

Which statute does a given buyer procure under, and why does that decide everything else?

Which statute does a given buyer procure under, and why does that decide everything else?

SECTIONS 7.2 AND 8.8 WHICH RULEBOOK APPLIES

SECTIONS 7.2 AND 8.8 WHICH RULEBOOK APPLIES

06

06

How much of an IT contract's value arrives after the award rather than at it?

How much of an IT contract's value arrives after the award rather than at it?

How much of an IT contract's value arrives after the award rather than at it?

SECTIONS 4.2 AND 5.2 THE TWO VARIANTS

SECTIONS 4.2 AND 5.2 THE TWO VARIANTS

ONE FIGURE FROM THE EDITION

ONE FIGURE FROM THE EDITION

The largest part of this market is also the most open.

The largest part of this market is also the most open.

The largest part of this market is also the most open.

Custom software development and IT consultancy holds 52.45 per cent of IT value and is at the same time the least concentrated segment, at 212.1 on the Herfindahl index across 740 winners. The pooled market figure is 160.0, but at segment level concentration runs between 1.33 and 4.99 times that figure, so a plan written against the pooled number is written against a market that does not exist at segment level.

Custom software development and IT consultancy holds 52.45 per cent of IT value and is at the same time the least concentrated segment, at 212.1 on the Herfindahl index across 740 winners. The pooled market figure is 160.0, but at segment level concentration runs between 1.33 and 4.99 times that figure, so a plan written against the pooled number is written against a market that does not exist at segment level.

FIGURE F1, SEGMENT VALUE AND WINNER CONCENTRATION, HEADLINE POPULATION.

FIGURE F1, SEGMENT VALUE AND WINNER CONCENTRATION, HEADLINE POPULATION.

What is in the 56 pages

What is in the 56 pages

What is in the 56 pages

PAGES SECTION WHAT IS IN IT

PAGES SECTION WHAT IS IN IT

3 to 4 About this report What the edition covers, and why the headline population is the primary CPV 72 and 48 cut of the register.

5 to 7 Executive summary Five readings this edition supports, each one traceable to a table.

5 to 7 Executive summary Five readings this edition supports, each one traceable to a table.

8 to 10 Methodology How new awards are separated from amendments, how value is treated, and what is left out.

11 to 19 Market X-ray How big the market is, where the money sits, who buys, who wins, and how concentrated each side is at market, segment and buyer level.

20 to 23 Segments Five segments, and hardware as a separate population that is never added to them.

20 to 23 Segments Five segments, and hardware as a separate population that is never added to them.

24 to 30 Guide for foreign suppliers Which statute applies, how the regime is assigned buyer by buyer, the qualification methodology, and where to start.

24 to 30 Guide for foreign suppliers Which statute applies, how the regime is assigned buyer by buyer, the qualification methodology, and where to start.

31 to 35 Playbook for Lithuanian suppliers Which of the two businesses you are actually in, how much arrives after the award, and how deep the customer list has to be.

31 to 35 Playbook for Lithuanian suppliers Which of the two businesses you are actually in, how much arrives after the award, and how deep the customer list has to be.

36 to 41 Limitations, sources and statements Every base, every limitation, the licence block and the independence statement.

36 to 41 Limitations, sources and statements Every base, every limitation, the licence block and the independence statement.

42 to 56 Annex The data package, the named tables printed in full, the glossary and the table index.

Page numbers refer to the PDF, cover included, so you know where everything is before you buy it.

Page numbers refer to the PDF, cover included, so you know where everything is before you buy it.

The four traps

The four traps

The four traps

NR THE TRAP WHY IT MATTERS

01 The published market is nearly twice the market you can bid for Counted as the register publishes them, these two years hold 12,580 IT contracts and 1.90 bn EUR. Counted once each, with re-pricing separated from new work, they are 11,442 contracts and 1.03 bn EUR.

02 Dispersion is not contestability The published winner concentration is 160.0 on the Herfindahl index, the most dispersed of the four sector cuts in this series. The median buyer with at least five IT contracts gives 41.0% of its IT value to a single supplier, and the median buyer level figure is 2,737.2.

03 One CPV range, two different businesses Open tender carries 20.108% of awards and 64.455% of value, while the two low value survey routes carry 60.996% and 8.656% of awards against 8.409% and 2.753%. A bid function built for one shape returns the wrong answer against the other.

04 Which rulebook applies is itself a band Buyers measurably on the utilities side hold 15.903% of IT value, 21.198% once group shared service companies are counted with them, and 33.379% at the widest defensible reading. Not one buyer sits on both sides.

NR THE TRAP WHY IT MATTERS

01 The published market is nearly twice the market you can bid for Counted as the register publishes them, these two years hold 12,580 IT contracts and 1.90 bn EUR. Counted once each, with re-pricing separated from new work, they are 11,442 contracts and 1.03 bn EUR.

02 Dispersion is not contestability The published winner concentration is 160.0 on the Herfindahl index, the most dispersed of the four sector cuts in this series. The median buyer with at least five IT contracts gives 41.0% of its IT value to a single supplier, and the median buyer level figure is 2,737.2.

03 One CPV range, two different businesses Open tender carries 20.108% of awards and 64.455% of value, while the two low value survey routes carry 60.996% and 8.656% of awards against 8.409% and 2.753%. A bid function built for one shape returns the wrong answer against the other.

04 Which rulebook applies is itself a band Buyers measurably on the utilities side hold 15.903% of IT value, 21.198% once group shared service companies are counted with them, and 33.379% at the widest defensible reading. Not one buyer sits on both sides.

All four are set out in full, with the rows, in the free extract. Get the free extract

How this edition is built

How this edition is built

How this edition is built

This note describes edition ERX-LTIT-2026-E1, the edition this page offers. Data as of 20 September 2026. Every statement below is tied to that extraction date. When a new edition is published this note is rewritten for it, and this version stays with the edition it replaces.

One frozen extraction. One stated pull of the source, reconciled and checksummed before the edition is built.

One frozen extraction. One stated pull of the source, reconciled and checksummed before the edition is built.

Every number tagged. No figure reaches the page without a tag naming the table it came from.

Every number tagged. No figure reaches the page without a tag naming the table it came from.

Twenty five release gates. An automated check stops the release when any one of them fails.

Byte for byte repeatable. A clean checkout rebuilds a file with the same checksum.

Byte for byte repeatable. A clean checkout rebuilds a file with the same checksum.

Who is named. Named tables carry legal persons only. Five independently written detection rules look for parties that are natural persons in law; of the 1,300 winners in the headline population 16 are a sole proprietorship or personal firm, and none of them is named.

Corrections are dated. Changes made before publication are not errata and are listed separately. An erratum is a change to something a buyer already holds, and it takes a new version number.

ANOTHER FIGURE FROM THE EDITION

ANOTHER FIGURE FROM THE EDITION

The market a bidder meets is the buyer, not the sector.

The market a bidder meets is the buyer, not the sector.

The market a bidder meets is the buyer, not the sector.

Pooled across the market, winner concentration is 160.0 on the Herfindahl index. Among buyers with at least five IT contracts the median gives 41.0 per cent of its IT value to one supplier, and the median buyer level figure is 2,737.2, roughly seventeen times the published one. The sector looks open and the individual account does not, and the account is what a sales plan is written against.

Pooled across the market, winner concentration is 160.0 on the Herfindahl index. Among buyers with at least five IT contracts the median gives 41.0 per cent of its IT value to one supplier, and the median buyer level figure is 2,737.2, roughly seventeen times the published one. The sector looks open and the individual account does not, and the account is what a sales plan is written against.

FIGURE F6, BUYER LEVEL SUPPLIER DEPENDENCY, HEADLINE POPULATION.

FIGURE F6, BUYER LEVEL SUPPLIER DEPENDENCY, HEADLINE POPULATION.

29,916 rows, 23 columns. One row is one contract.

29,916 rows, 23 columns. One row is one contract.

29,916 rows, 23 columns. One row is one contract.

Open contracts_it_services.csv in your spreadsheet. Click any cell, then Insert, PivotTable, OK. Drag ernex_segment to Rows and value_capped_eur to Values.

Open contracts_it_services.csv in your spreadsheet. Click any cell, then Insert, PivotTable, OK. Drag ernex_segment to Rows and value_capped_eur to Values.

REPORT

590 EUR

The report, 56 pages, English, PDF

One organisation, unlimited named users

Perpetual licence for this edition

Buy the report

REPORT AND DATA PACK

990 EUR

Everything in Report, and

The IT and digital contract level data set, 29,916 rows, 23 columns, CSV and Excel

The data dictionary and the licence

Checksums for every file

Buy the report and data pack

GROUP LICENCE

1,690 EUR

Everything in Report and data pack, for

Up to five organisations in one group

A separate stamped copy and licence number for each

Buy for five organisations

All prices exclude VAT. VAT is added at checkout. Issued within one working day, to the email address used at checkout, in a folder shared with that address only. Each copy is stamped with its licence number. Licence terms.